A map may be flat, but the landscape it represents rarely is. Hills rise, valleys fall away, slopes change in steepness and ridges stretch across the landscape. Contour lines are the map's way of showing these changes in height and shape, allowing a three-dimensional landscape to be represented on a two-dimensional surface.
At first they can look like little more than a collection of curved lines running across the map. Once you understand what they represent, however, they begin to reveal much more. Their spacing can show whether the ground ahead is steep or gentle, their shape can help identify valleys and ridges, and their pattern can give you an idea of what the landscape might look like before you reach it.
What Contour Lines Mean
A contour line joins together points that are at the same height above sea level. If a contour is marked as 150 metres, every point along that line is approximately 150 metres above sea level. Another contour higher up the slope might represent 160 metres, followed by 170 metres and so on. The important point is that a contour does not show a physical feature running across the landscape. It represents a level of height.
One way to picture this is to imagine a hill partly submerged in water. If the water level dropped in stages, each previous shoreline would leave a line around the hill. Viewed from directly above, those lines would begin to resemble the contours shown on a map. Together, they provide a way of showing the shape of the ground without needing a three-dimensional model.
Understanding the Contour Interval
The vertical difference in height between neighbouring contour lines is known as the contour interval. If one contour represents 100 metres and the next represents 110 metres, the contour interval is 10 metres. This is a difference in height, not the horizontal distance between the lines on the ground, and that distinction becomes important when you begin looking at their spacing.
The interval used can vary depending on the mapping and the type of terrain being represented. Smaller intervals are useful in flatter areas because they allow subtle changes in height to be shown, while steeper terrain may require a larger interval to prevent the map becoming crowded with contour lines. For this reason, it is always worth checking the map legend rather than assuming that every map uses the same interval.
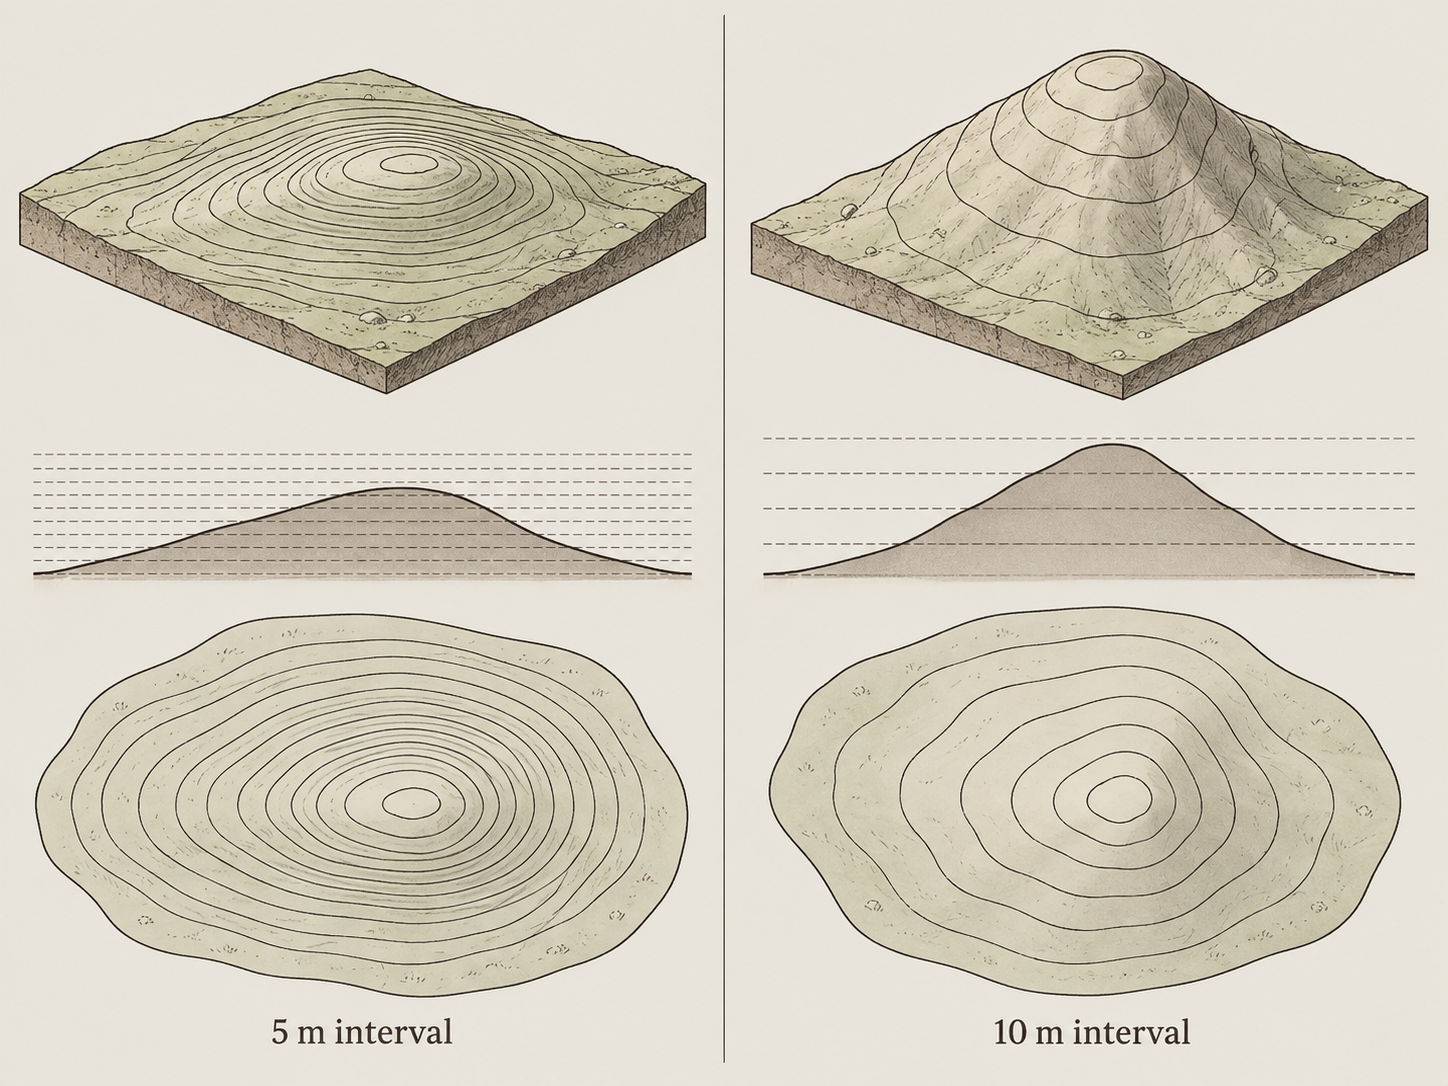
Contour intervals determine how much height change each line represents. Smaller intervals reveal more detail, while larger intervals are useful for showing broader terrain shapes.
Reading Steep and Gentle Slopes
The spacing between contour lines tells you about the steepness of the ground. Where the contours are widely spaced, the height changes gradually over a greater horizontal distance and the slope is gentler. Where the contours are closely spaced, the same change in height takes place over a much shorter distance, indicating steeper ground.
The pattern can also show how a slope changes as you move across it. Contours that remain evenly spaced suggest a fairly consistent gradient, while contours that gradually move closer together show that the slope is becoming steeper. If they begin to spread further apart, the ground is easing. This can be particularly useful when looking ahead along a planned route, because a short climb over tightly packed contours may feel very different from a longer climb over more gently rising ground.
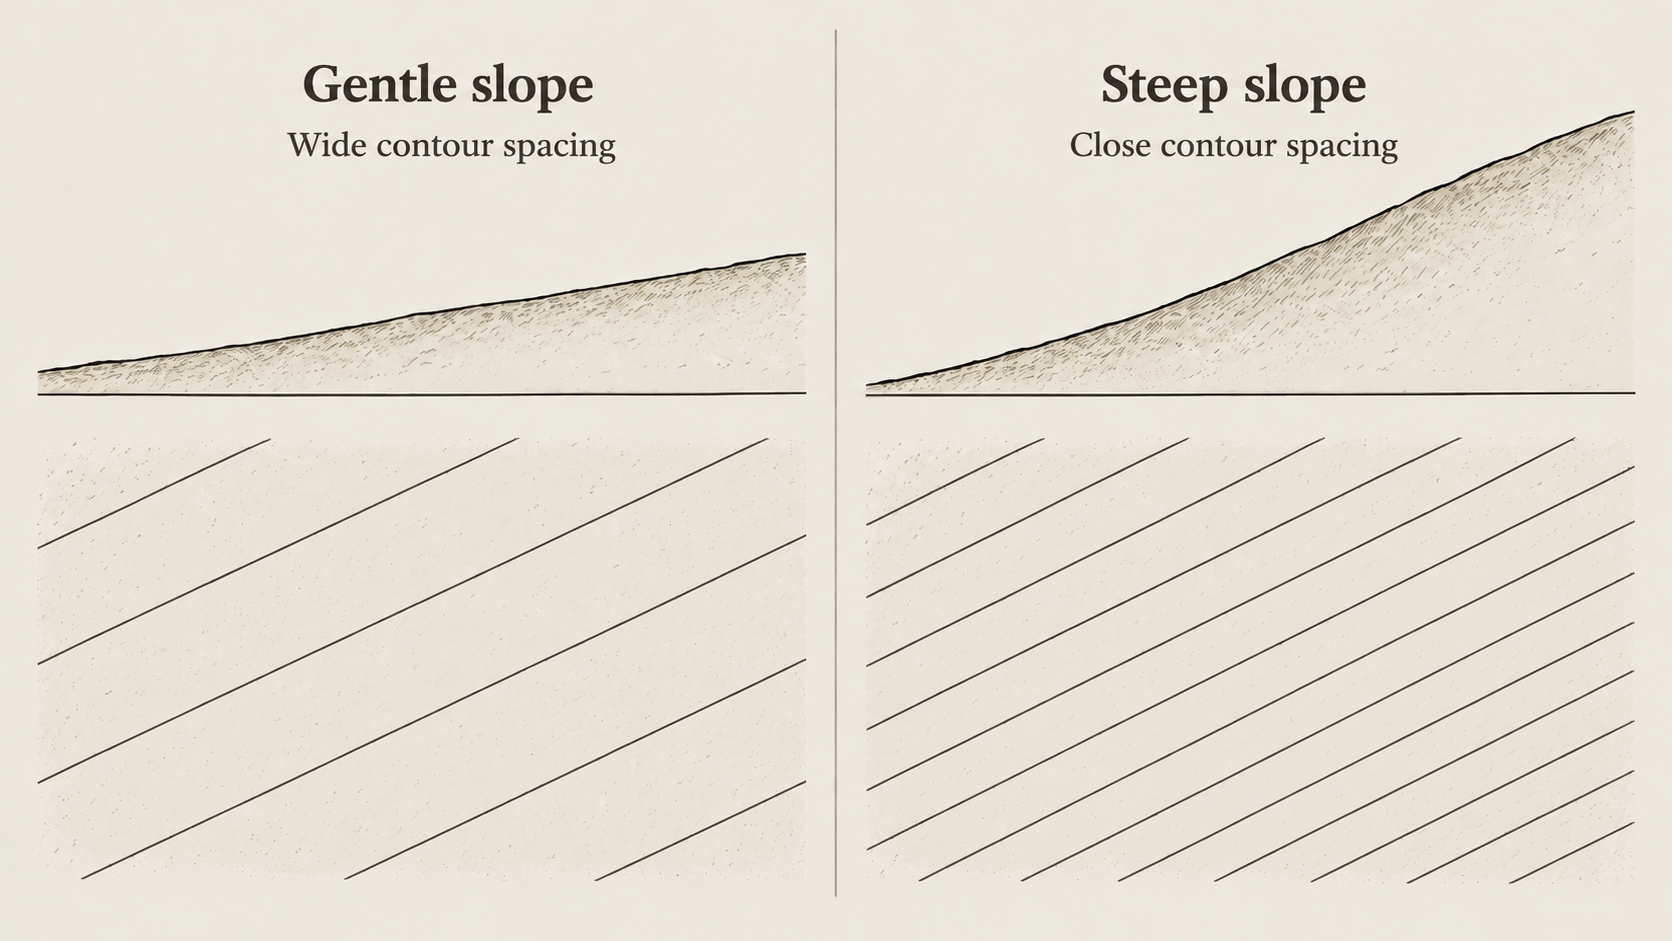
Contour intervals determine how much height change each line represents. Smaller intervals reveal more detail, while larger intervals are useful for showing broader terrain shapes.
Understanding Which Way the Ground Slopes
Contour spacing tells you how steep the ground is, but you also need to know which direction it rises and falls. The height values printed on contour lines provide a useful clue. On OS maps, the contour numbers are arranged so that they read uphill, meaning the top of the number points towards higher ground and the bottom towards lower ground.
Another way to picture the slope is to imagine which direction water would naturally run. Water will tend to follow the steepest route downhill, crossing the contour lines rather than following them. This downhill direction is sometimes called the fall line and, on a simple slope, it will usually cross the contours at roughly a right angle.
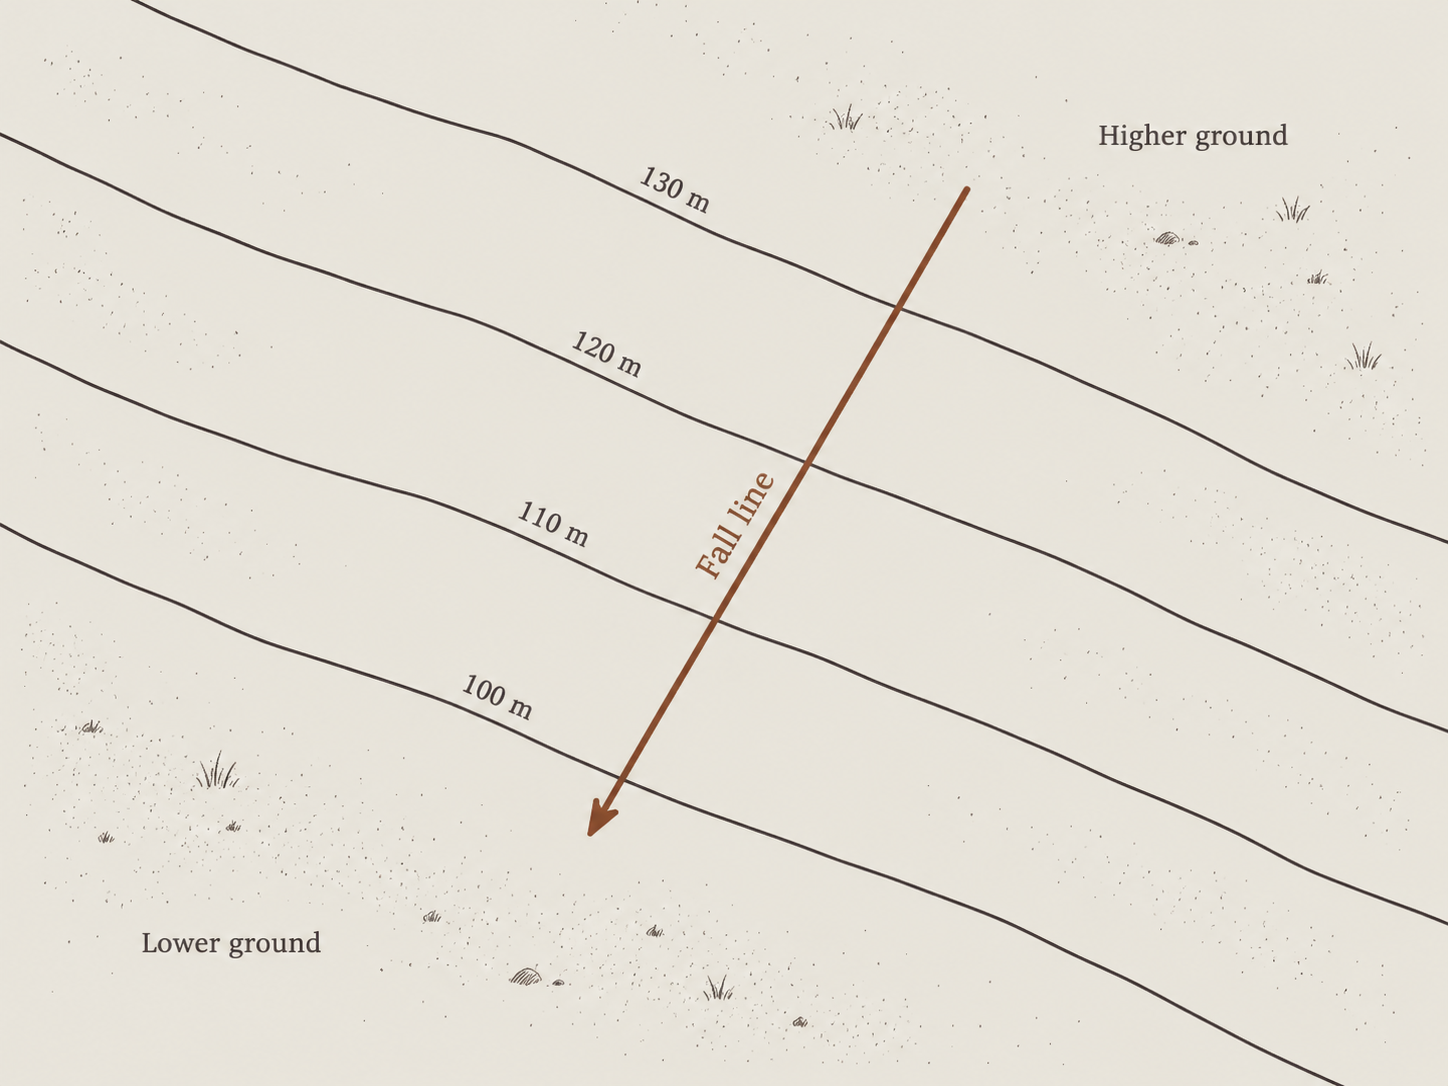
The fall line shows the direction of steepest descent. It crosses contour lines at right angles, from higher ground towards lower ground.
Recognising Hills and Summits
A hill will often appear as a series of enclosed contour lines, with the height increasing as the contours move inward towards the centre. Viewed on the map, these can look like a series of nested rings, but in the landscape they represent the sides of a hill rising towards higher ground.
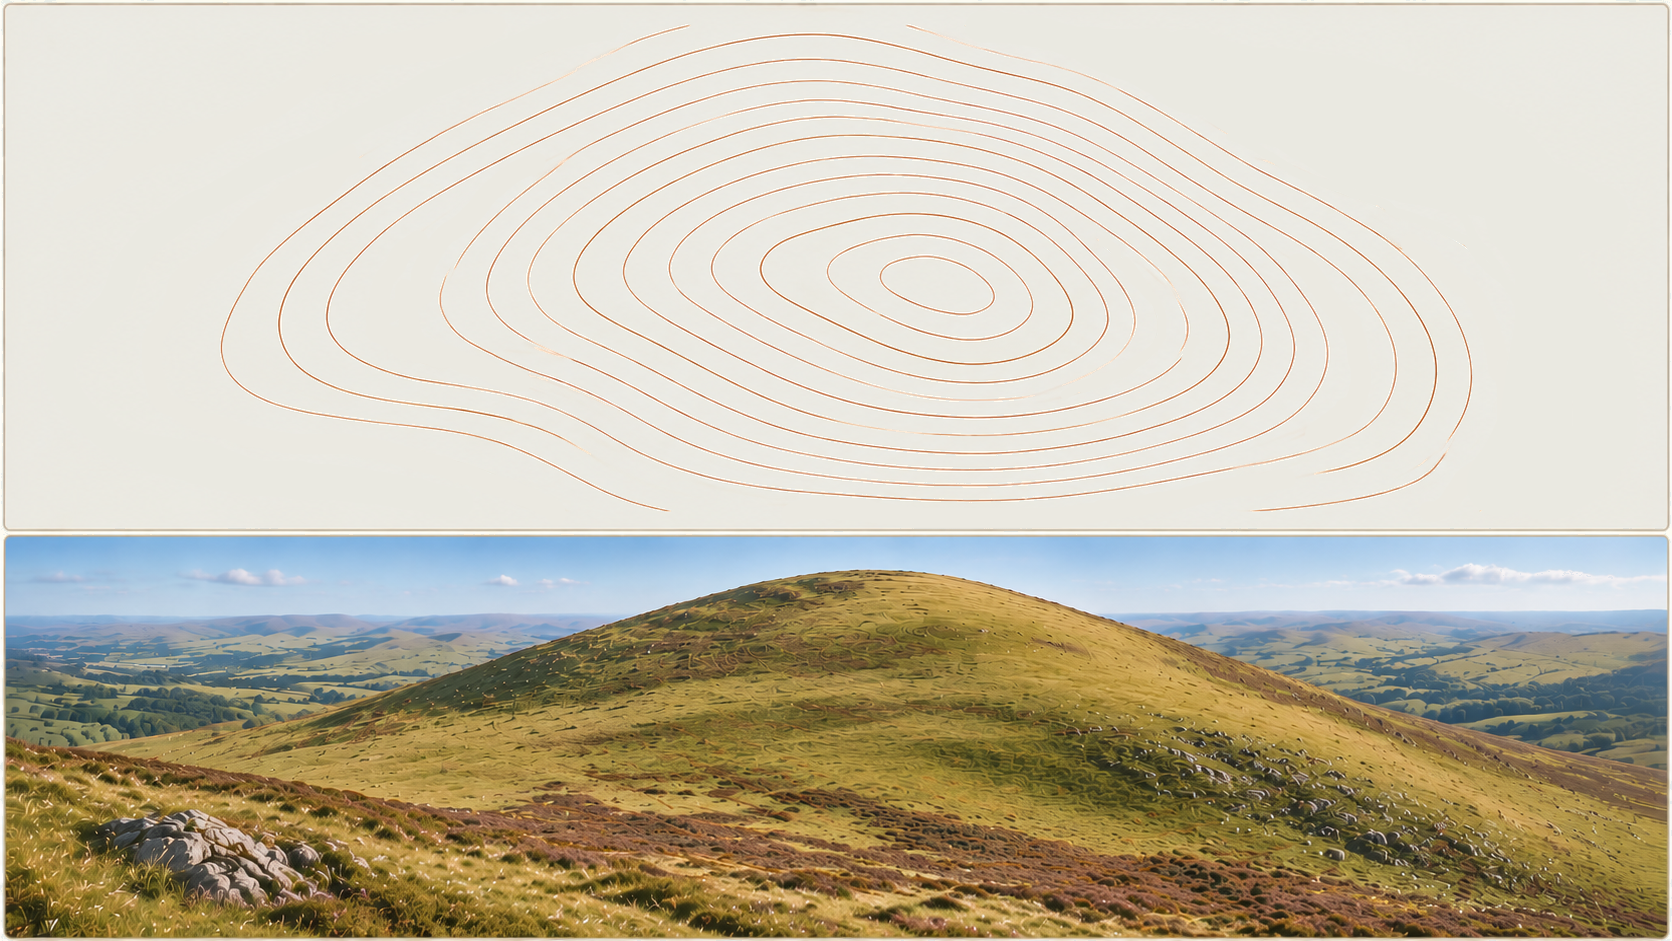
The spacing of those contours still matters. A hill with widely spaced lines may have broad, gentle slopes, while one with tightly packed contours may rise much more sharply. The highest point does not necessarily sit directly on a contour line, and you may sometimes see an individual height marked nearby as a spot height, but the main skill here is recognising the overall shape created by the contours themselves.
Valleys, Ridges and Spurs
Contours can show much more than simple hillsides. Where they cross a valley, they tend to bend towards higher ground, often creating a series of V-shaped or U-shaped patterns pointing uphill. Streams and rivers can provide another useful clue because they naturally follow lower ground, so a watercourse running through a series of inward-bending contours is a strong indication that you are looking at a valley.
Ridges and spurs form a different pattern. A ridge is an area of higher ground extending away from a summit or elevated area, while a spur is a smaller finger of high ground projecting out from a hillside or ridge. A spur can sometimes look superficially similar to a valley on the map, so the important thing is to check the direction of increasing height. In a valley, the contour shapes point towards higher ground, while on a spur the shape projects towards lower ground.
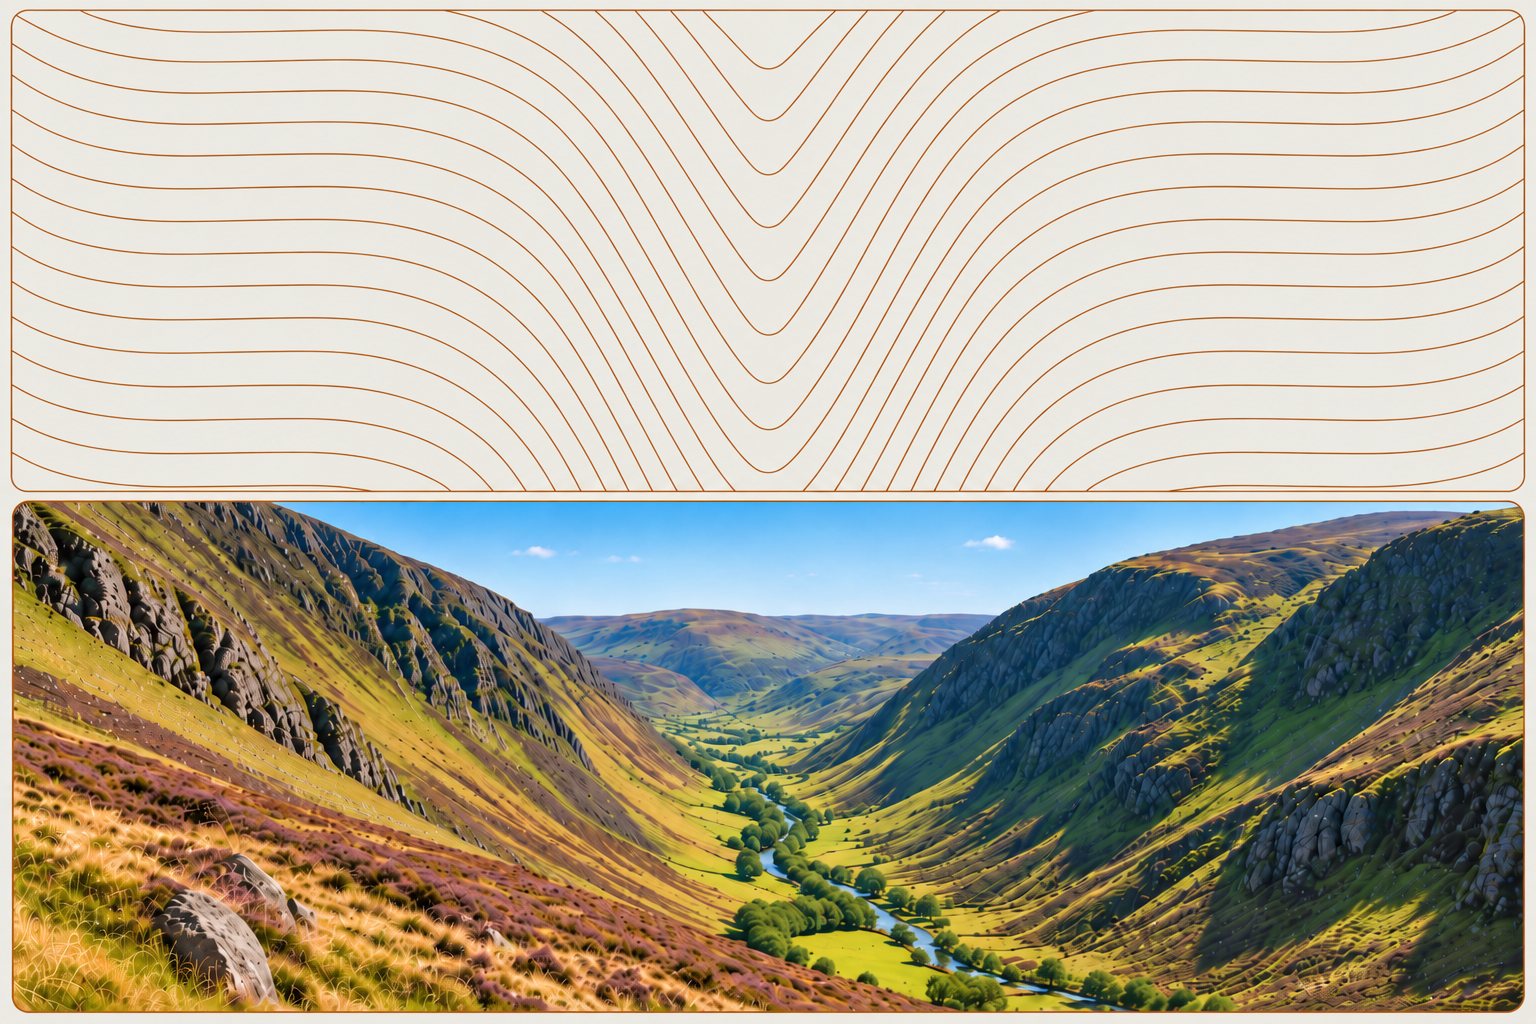
Valley contours form V-shapes that point towards higher ground.
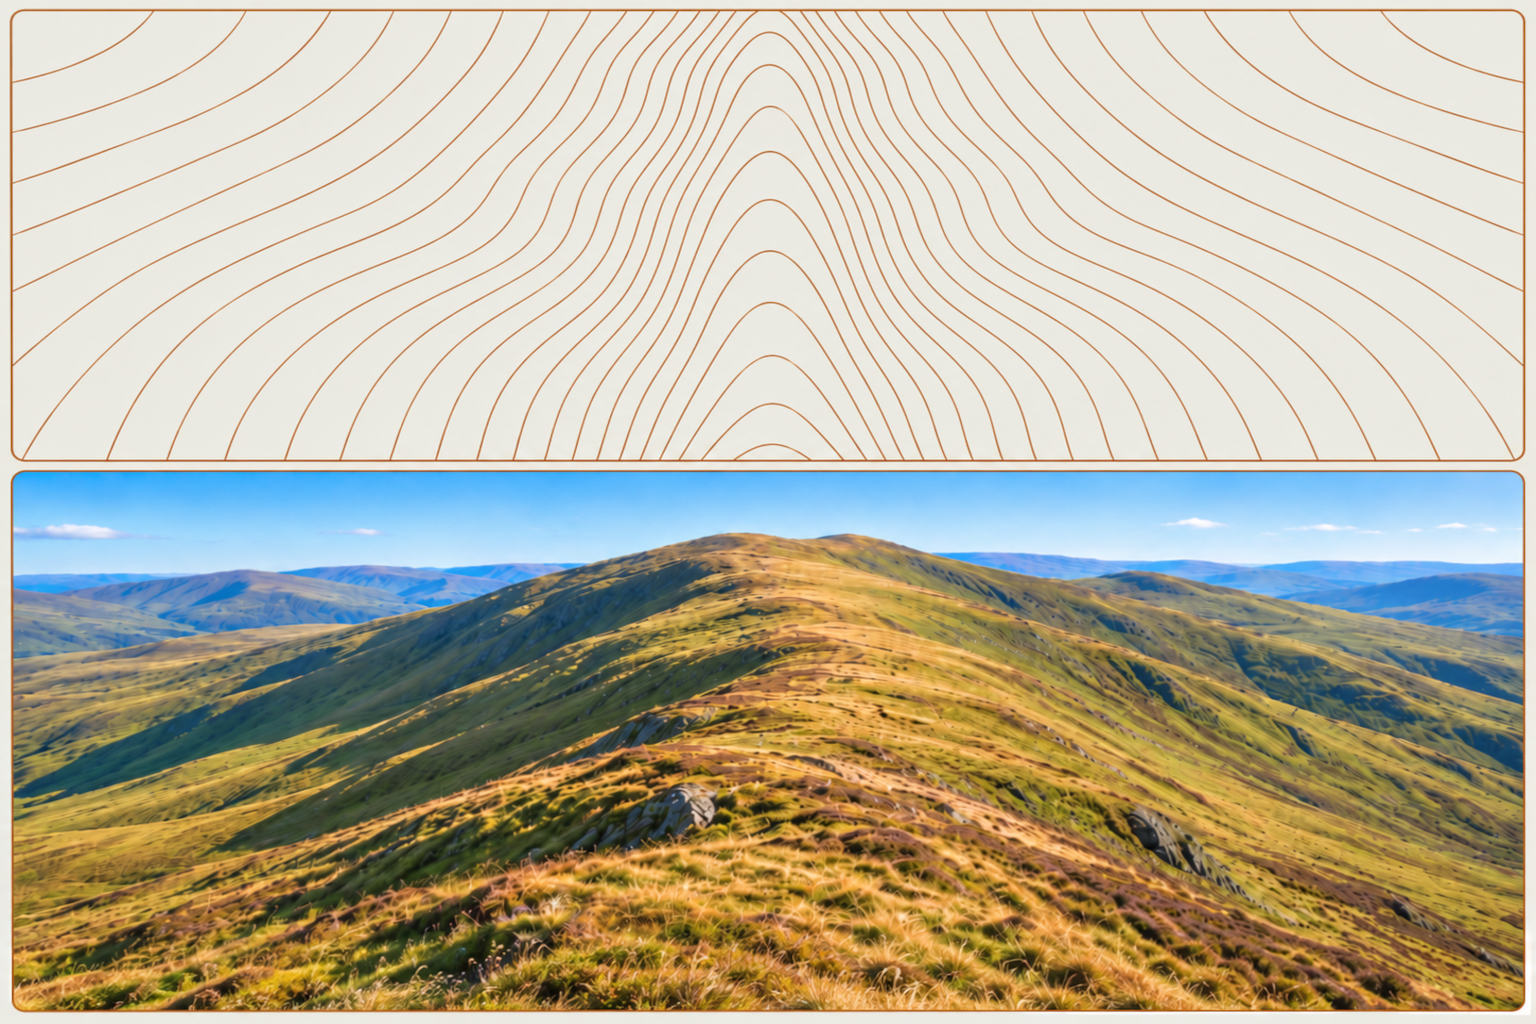
Ridge contours show a line of higher ground with slopes dropping away on both sides.
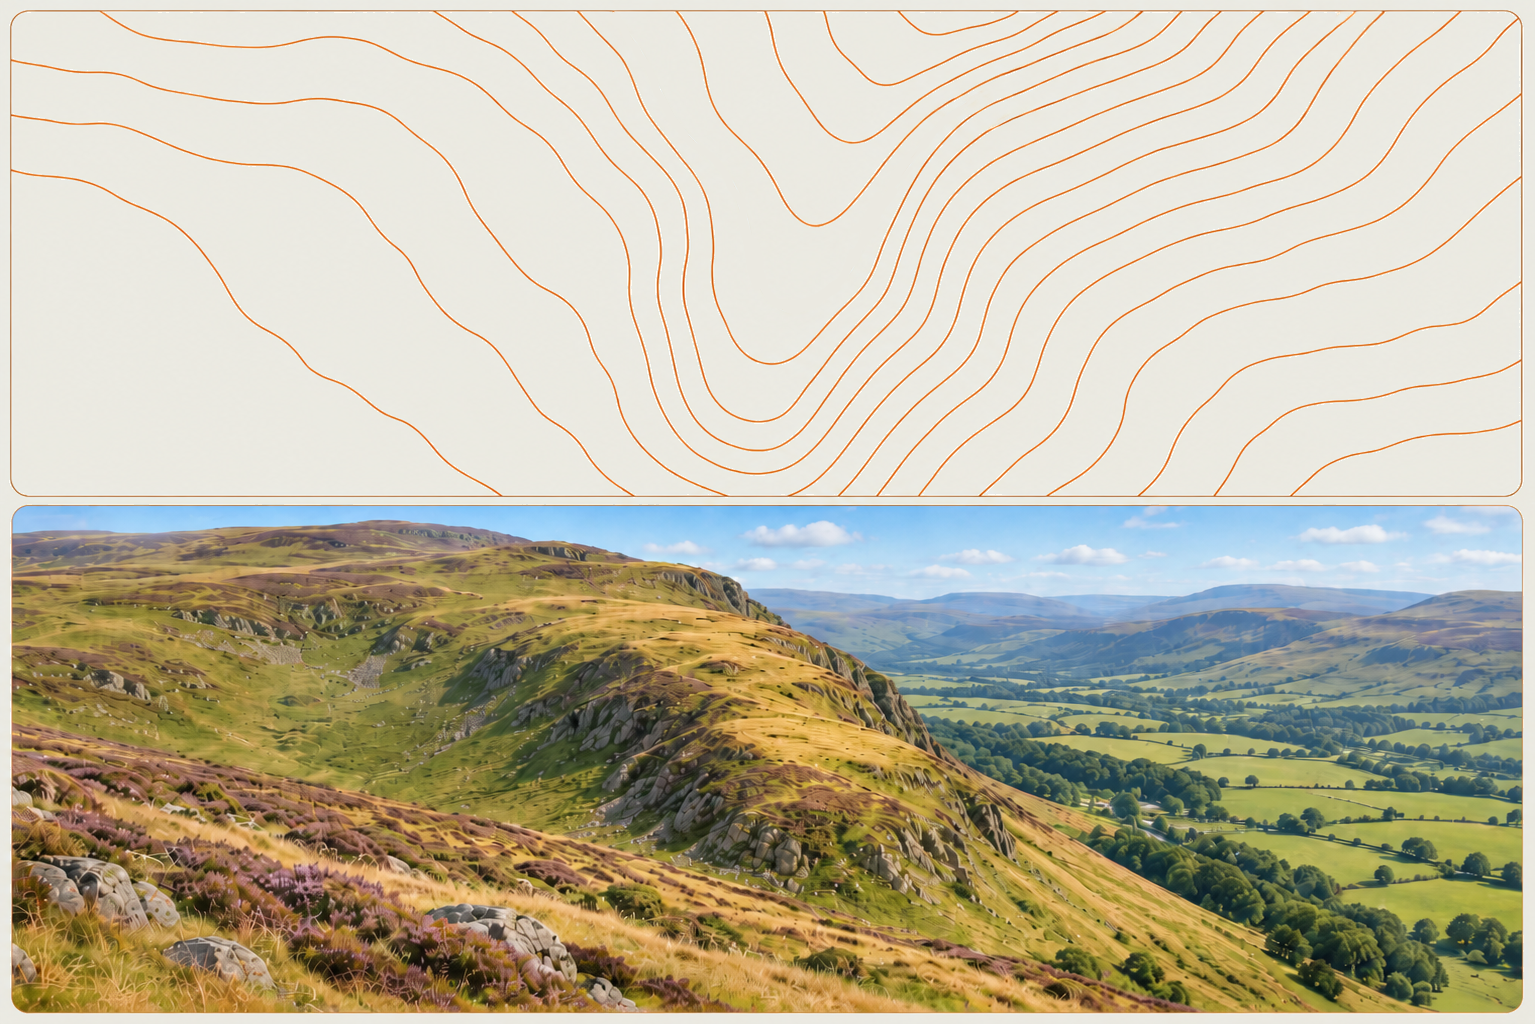
Spur contours show a tongue of higher ground extending out from a ridge, with lower ground on either side.
Turning Contours into a Mental Picture
The real value of contour lines comes when you stop seeing them simply as individual lines on a map and begin to imagine the landscape they represent. A broad area with very few contours may be relatively flat, a tightly packed group may indicate a steep hillside, closed contours may form a hill, and lines folding around a stream may reveal a valley cutting through the landscape.
With practice, these patterns begin to combine into a three-dimensional picture. One useful exercise is to compare the map with the landscape in front of you. Pick out a visible hill, ridge or valley and then find the same feature on the map, paying attention to how its real shape has been translated into contour lines. Repeating this helps build the connection between what you see on the map and what you see on the ground.
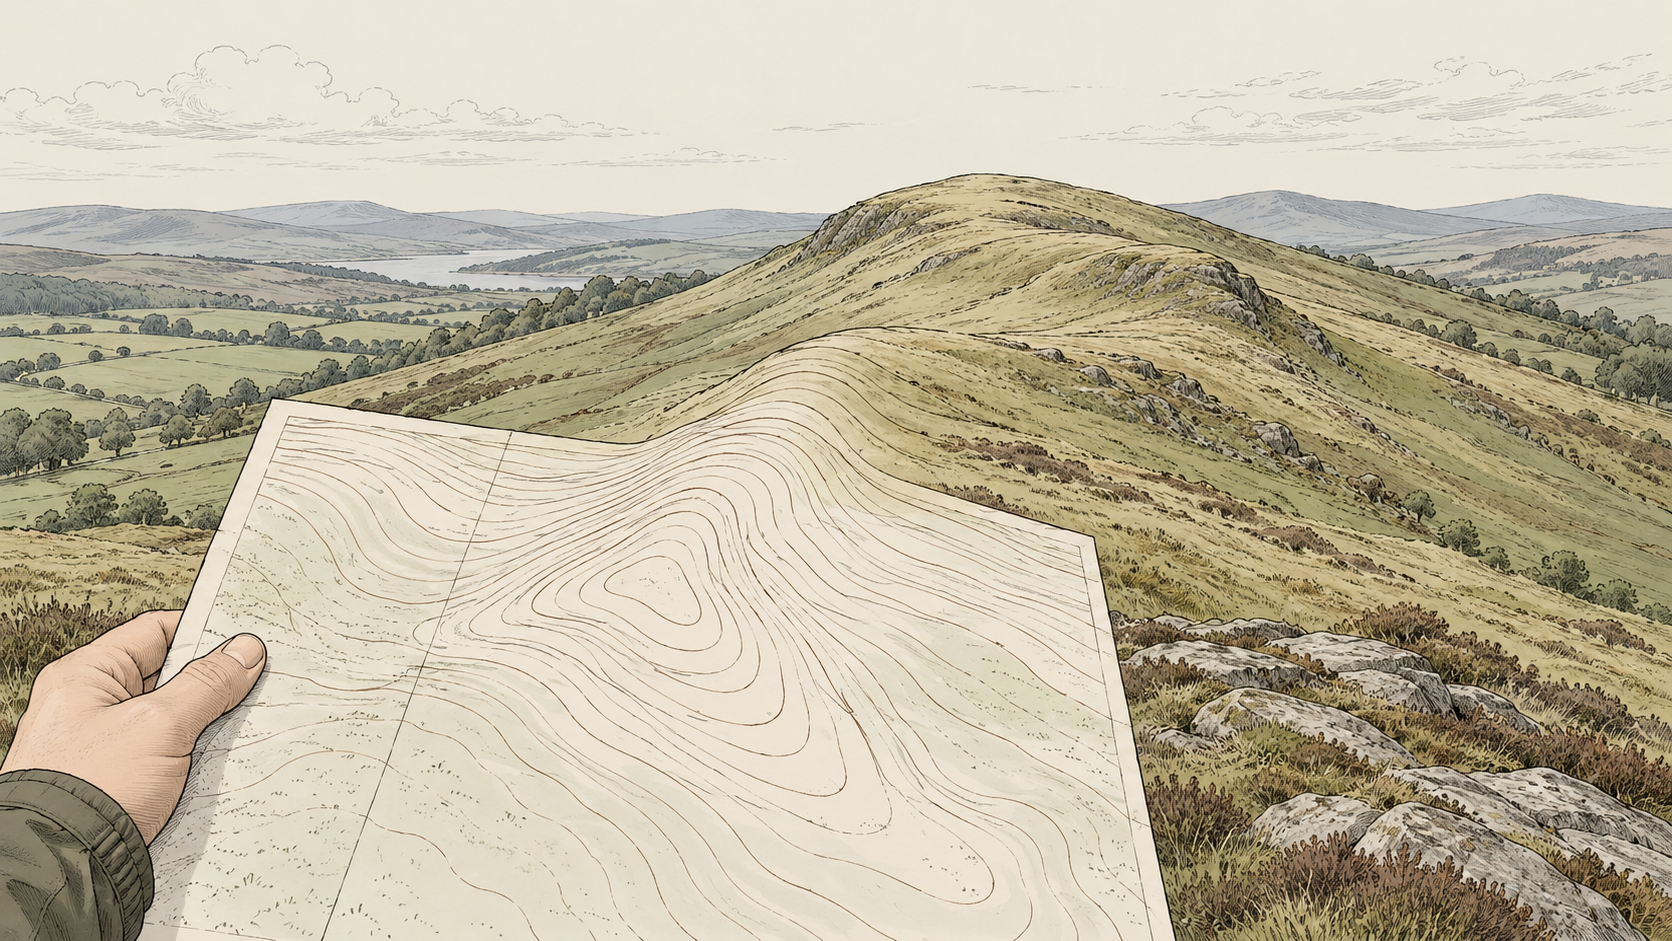
Seeing the Shape of a Route
Distance alone does not tell you what a walk will feel like. Two routes may cover a similar distance but involve very different terrain. One might follow a broad valley with only gradual changes in height, while another could cross several tightly packed sets of contours and involve repeated climbing and descending.
Looking at the contours along a route therefore gives you another layer of information when planning a walk. You can identify where the main climbs begin, how long they continue, whether the gradient changes and whether a descent is likely to be gentle or abrupt. Looking beyond the path itself can also help you understand the wider landscape, such as whether the route runs beneath a ridge, crosses the head of a valley or follows a shelf of gentler ground between steeper slopes.
Applying This on a Walk
Before setting out, trace your planned route on the map and look specifically at the contours rather than only the paths and tracks. Consider where you will gain or lose height, which sections appear steep, whether the slope becomes easier or harder as you climb, and whether you are travelling through a valley, along a ridge or across the side of a hill.
Then compare those expectations with what you encounter on the ground. If you reach a steep climb where the contours were tightly packed, make the connection between the map pattern and the physical slope. If the ground begins to flatten as the contours spread apart, notice that too. Over time, this turns contour reading from something you consciously decode into something much more intuitive.
The aim is not simply to know what a contour line means. It is to be able to look at a flat map and begin to see the landscape taking shape.